1 Establishing a Compensation Range for Columbia Association CEO
• The bill requires the Columbia Association Board of Directors, beginning with the next CEO employment contract, to set the CEO’s annual compensation which is no more than 110% of the annual salary of the Howard County Executive in effect at the time the CEO is hired.
2 Classifying Columbia Association Board Members as Non-Employees
The bill explicitly classifies the 10 elected members of the Columbia Association Board of Directors as non-employees of the Columbia Association.
3 Reducing the Columbia Association Annual Charge Rate Cap
• The bill reduces the maximum Columbia Association annual charge rate from $0.75 to $0.68 per $100 of 50% of the assessed value of real property.
• The bill also requires the applicable regulatory language to express the rate cap more clearly as 0.34% of the assessed value of real property, which is mathematically equivalent to $0.68 per $100 of 50% of assessed value.
4 Granting Records to Office of the Inspector General of Howard County
• This bill is the reintroduction of Ho.Co.15-26.
• Please add in below language:
Section 4-302 of the General Provisions Article (Public Information Act):
Notwithstanding the required denials in Parts II and III of this subtitle, the Howard County Office of the Inspector General shall have access to and may inspect a public record or part of a public record.
5 Restructuring By-District Board Member Election of Montgomery County Board of Education
-Please mirror the language of MC04-22.
This bill requires the five by-district members of the Montgomery County Board of Education to be elected by a plurality of the voters who reside in their respective Board of Education districts. The bill does not change the election method for the two countywide members, who will continue to be elected by voters countywide.
Join Delegate Chao Wu for a re-election campaign fundraiser at Bushel and a Peck Kitchen & Bar (12250 Clarksville Pike Ste H, Clarksville, MD 21029) on September 29th from 6-7:30 PM. We are pleased to be joined by special guests, Speaker Joseline Peña-Melnyk, Senator Katie Fry Hester, the Honorable Susan Lee, and Congresswoman Sarah Elfreth!
We received another rate increase letter/email from BGE. As a Maryland State Delegate, I am going to send the following reponse to them. They seems to understand the families struggle, but they did not talk about fair funding, and accountability.
Families Deserve Reliable Service and Affordable Bills
The recent storms left more than 100,000 Maryland customers without power during extreme summer heat. For many families, losing electricity is more than an inconvenience. It means spoiled food, missed work, disrupted childcare, health risks for seniors and medically vulnerable residents, and uncertainty about when service will be restored.
At the same time, Maryland families are facing rising costs for housing, groceries, insurance, healthcare, and energy. Even what may appear to be a modest increase in a utility bill can have a meaningful impact on household budgets.
The yearly quick growth of energy cost has been a huge difficulty for every Maryland family.
The challenge before us is not simply how to keep the lights on. It is how to maintain and modernize our electric system while protecting Maryland families from bearing an unfair share of the cost.
We Need a Different Investment Model
The current utility model relies heavily on ratepayer-funded investments. While customers benefit from a reliable electric grid, they should not be expected to shoulder nearly all of the financial burden.
Maryland should examine alternative approaches that distribute costs more fairly among all beneficiaries of the system.
Option 1: Shared Responsibility Model
Infrastructure investments should be funded through a combination of:
Ratepayer contributions
Utility shareholder contributions
Commercial and industrial customer contributions
Federal and state grants where available
Under this approach, shareholders would be expected to reinvest a portion of earnings into reliability and resilience improvements before residential customers are asked to absorb the full cost.
Option 2: Reliability and Resilience Fund
Utilities could dedicate a percentage of annual profits to a reliability reserve fund that supports:
Aging infrastructure replacement
Storm hardening
Vegetation management
Emergency response preparedness
This would demonstrate that shareholders are contributing alongside customers.
Option 3: Growth Pays for Growth
Maryland is experiencing increasing demand from data centers and other large energy users.
When new infrastructure is required primarily to serve large-load customers, those customers should pay a proportionate share of the associated costs. Residential ratepayers should not be subsidizing infrastructure expansions driven by future commercial growth.
Option 4: Performance-Based Regulation
Utilities should be rewarded not simply for spending money, but for delivering measurable improvements in reliability, resilience, and customer service.
Accountability Must Accompany Any Rate Increase
Customers have been asked to pay more each year, they deserve transparency and measurable results.
Before any major rate increase is approved, utilities should clearly disclose:
How much shareholders are contributing
Expected reliability improvements
Alternative lower-cost scenarios considered
Executive compensation and administrative cost trends
Impact on residential, small business, and low-income customers
Most importantly, there should be specific performance targets.
For example:
Metric
Current
Target
Average outage duration
Baseline
Reduced by 20%
Average outage frequency
Baseline
Reduced by 25%
Storm restoration time
Baseline
Faster restoration
Customer bill burden
Baseline
Minimized increase
If those targets are not met, there should be consequences. If utilities exceed expectations, reasonable incentives may be appropriate. Accountability must work both ways.
Conclusion
Marylanders expect reliable electric service. They also expect fairness.
The question is not whether investments are needed. The question is how those investments are financed and whether customers receive measurable improvements in return.
We should not expect utlitily companies receives historical and growing profits while everyday ratepayers pay more and more to their profit.
BGE rate increase letter
Dear Customers,
First, I want to thank you for your patience during the severe storms that hit our region last week—especially the more than 100,000 customers who lost power. Being without electricity is frustrating under any circumstances, particularly in extreme heat. I’m grateful for your patience as our crews worked around the clock to restore service.
It’s never easy to ask customers to pay more—especially at a time when so many families are already feeling the pressure of higher prices.
That’s why I wanted you to hear it directly from me.
Recently, BGE filed a request that, if fully approved, would increase electric delivery rates beginning next year by about $8 for a residential customer with average usage. I know many people will understandably ask, “Why now?”
You deserve a clear answer.
Like every family and business, we’re facing rising costs. But let me be clear—this request isn’t about expanding our business or taking on new projects. In fact, we’ve intentionally scaled back our investments and focused only on the work we believe is absolutely necessary to keep the lights on for the more than 1.3 million customers who depend on us every day.
I also want you to know that we understand what’s happening around your kitchen table. The cost of groceries, housing, childcare, healthcare, and just about everything else has gone up.
For many families, another bill—even a small one—matters. We don’t take that lightly, and we didn’t make this decision lightly either.
Much of the equipment that delivers electricity to your home was built many decades ago. Every year we have to make decisions about what can safely wait and what simply can’t. This plan focuses on the work that cannot wait to make sure the system can continue to serve our communities safely and reliably. However, there is a risk that deferring work could increase the risk of more frequent and prolonged service outages and emergency repairs that can be more expensive than planned, proactive replacements.
This is not a wish list. This is the minimum amount of work we believe must be done to continue providing the reliable service our customers expect—on ordinary days and when severe weather puts our system to the test.
Many of you saw just how important that work is during the severe storms that hit our region last week. When severe weather hits, customers rightly expect us to be ready—with people, equipment and resources to respond. Part of this proposal is about making sure we can continue to do that.
The next step is that the Maryland Public Service Commission will carefully review every dollar we’ve requested, and there will be opportunities for customers, consumer advocates, and other stakeholders to participate throughout the process.
Just as important as keeping your lights on is helping customers manage their bills.
Whether it’s through payment arrangements, energy assistance programs, energy savings tools, or other resources, we want every customer to know that help is available. If you’re struggling to pay your bill, please reach out before it becomes a crisis. We have a team ready to work with you.
I know trust isn’t earned through words alone. It’s earned by being honest, by listening, and by delivering on our commitments.
You have my commitment that we will continue to be transparent throughout the process. We’ll explain what we’re proposing, answer difficult questions, and keep working every day to keep costs as low as possible.
Letter to Maryland Legislators Regarding Leadership at Bowie State University
This is not unique. UMD laying offer workers, Montgomery County Public School System laying off employees. We received a letter from Bowie State University too.
Date: June 2, 2026
Dear Honorable House Representative,
We write to you today with grave concern regarding the financial crisis facing Bowie State University, the proposed $18.5 million in cuts, and the devastating impact these decisions will have on students, faculty, staff, and the surrounding community. This crisis was not unavoidable. It is the direct result of leadership failures, fiscal mismanagement, and a prolonged lack of accountability at the highest levels of administration.
Faculty and staff are now being asked to bear the consequences of decisions they neither made nor supported. Proposed layoffs, retrenchments and department merging threaten the core educational mission of the university and will severely diminish the student experience. Students will lose access to critical academic support, mentoring, advising, programming, and opportunities essential to their success and retention. Bowie State cannot maintain its current US News ranking of being tied at #11 for the best HBCU with significantly fewer resources and personnel.
This crisis did not emerge overnight. Faculty and staff have repeatedly raised concerns regarding administrative decision-making, declining enrollment strategies, excessive spending on contractors and consultants, unilateral program cuts, and the absence of meaningful corrective action. Despite these warnings, leadership failed to act with the urgency and transparency required to protect the institution.
How did Bowie State University fall from the third fastest-growing college or university in Maryland in 2019 to having the greatest enrollment decrease within the University System of Maryland in 2025? For four consecutive years, the enrollment has declined, dropping 10.8% from Fall 2021.
We ask that you consider some examples of fiscal mismanagement and harmful administrative decision-making such as the implementation of policies that reduce retention and graduation rates, excessive spending and reliance on consulting firms and contractors, increased hiring and salaries of administrators, to name a few.
Moreover, these actions will harm not only the university, but also the local economy, workforce pipeline, and surrounding community that rely on this institution.
· During a shortage of nurses, BSU has cut its Master of Nursing (MSN) programs and an alarming rate of attrition of nursing faculty is currently underway due to administrative decisions.
· During a shortage of teachers, BSU has failed to honor partnerships with local and regional K-12 school systems to support workforce development, graduate education, and career-lattice opportunities aligned with Maryland’s Blueprint for Maryland’s Future goals.
· With the increased mortality of African-American woman during childbirth, BSU has rejected the Maryland Department of Health (MDH)-approved doula training and certification program.
· With suicide being the second leading cause of death among youth aged 10–24, BSU has undermined its National Association of School Psychologists (NASP)-accredited school psychology program.
Rather than addressing the root causes of the crisis, leadership now proposes balancing the budget on the backs of faculty, staff, and students. This approach is unacceptable and unsustainable. The administration did not account for over $3M in unbudgeted expenses. Consequently, 26 staff will be laid off in FY27 and an unknown number of faculty will be retrenched in FY28. And the administration falsely believes that “Students should not experience any direct impact from the budget deficit remediations.”
The overwhelming lack of confidence in the current leadership is undeniable. Most recently, 86% of full-time faculty attendees voted that they have no confidence in the leadership of the President Aminta H. Breaux. In March 2025, 68% of faculty voted that they had no confidence in the leadership of Provost Guy-Alain Amoussou. The faculty voted again in 2026 with a supermajority expressing no confidence in the provost. These votes reflect deep and longstanding concerns regarding the direction, management, and credibility of university leadership. The individuals responsible for the current state of the institution are not trusted to lead the university through this crisis.
We are also deeply concerned by the lack of action and urgency demonstrated by the by the University System of Maryland Office of the Chancellor, despite repeated warnings from different constituent groups and visible signs of institutional decline over the past year. The Bowie State University Faculty Senate contacted him regarding the 2025 vote of no confidence in the Provost and he was aware of the CUSF resolution that passed with regards to Bowie State University. We urge you to ask why stronger intervention, oversight, and support were not provided sooner, especially for an HBCU facing mounting financial and enrollment challenges.
As elected officials and stewards of public institutions, you have both the authority and responsibility to demand accountability. The Governor appoints members of the Board of Regents, and state leadership has influence over the Chancellor and presidential selection process. We urge you to use that authority now.
We respectfully call on you to:
· Demand immediate accountability from university leadership and the Chancellor
· Oppose harmful layoffs, retrenchments, and department merging that will damage student success
· Require forensic accounting to acquire an unabridged review of administrative spending and financial decisions
· Ensure previously negotiated compensation agreements are honored
· Push for leadership changes necessary to restore trust and stability
· Protect the mission and future of this institution and the students it serves
Other USM institutions facing statewide budget cuts have found ways to increase enrollment, stabilize budgets, and grow revenue without dismantling their workforce or undermining academic quality. Our institution deserves leadership capable of pursuing real solutions rather than imposing devastating cuts on the people most responsible for student success.
A financial investment in Bowie State University, like the unrestricted Mackenzie Scott Award of a combined $75M, is an investment in students, workforce development, economic mobility, and the future of our community. However, funding alone cannot solve a crisis rooted in failed leadership and poor oversight. Accountability must begin at the top.
We urge you to heed our call and act now before irreversible damage is done to Bowie State University, its students, and the community that depends upon it. Bowie State University is Maryland’s Oldest HBCU, operating for over 160 years. It is the only HBCU in Prince George’s County, and PG is home to approximately 20,000 BSU alumni. Please do not let Bowie State University be added to the list of ELEVEN HBCUs that have closed due to financial instability and/or administrative mismanagement.
Subject: MSP Leadership and Career Development Seminar for Students
Dear Delegate Wu,
The Maryland State Police announces that applications are now being accepted for the annual Leadership and Career Development Seminar, which will take place from July 17-19, 2026. The goal of the free event is to develop interest and introduce high school rising juniors and seniors, and incoming college freshmen to career opportunities with the Department.
The three-day, action-packed seminar will be held at the Maryland State Police Training Academy in Sykesville. Those interested in starting a career in law enforcement – either sworn or civilian – are invited to learn about the Maryland State Police from troopers and civilian employees who specialize in a wide range of expertise. The seminar is a way to identify young talent and build a relationship with the community. The goal is to provide participants with hands-on experiences and an introduction to the Department’s mission-critical career opportunities.
Attendees will learn about emergency communications, fitness and defensive tactics, facets of a law enforcement career, aviation/flight paramedics, leadership, digital forensics/cybersecurity, and details into our diverse civilian occupations. Troopers and civilian employees from various specialized units will be on hand to share their experiences about life as a state trooper or as a civilian employee in a law enforcement career. This will include representatives from Criminal Investigations, Forensic Sciences, Police Communications, Information Technology, and the Office of the State Fire Marshal.
Along with this exciting opportunity, food and lodging will be provided on the campus of the Maryland State Police Academy. Each barrack commander will select one applicant to represent their respective county, including Baltimore City.
A Regional Public Development Bank for East Coast Infrastructure
Office of Delegate Chao Wu, District 9A, Maryland House of Delegates
Prepared for the Maryland General Assembly | May 2026
I have been advocating for a 5 trillion dollars NIB (National Infrastructure Bank). Now it seems the political climate will not get it through easily. So I am proposing an ECIIB (East Coast Infrastructure Investment Bank) to connect 11 states (including DC) to support infrastructure development.
As a former CA board members, I would like to see Columbia Association to shine as a self-governed homeowner association, with Jim Rouse vision. CA is unique in many aspects, with more than 100k people livining under CA, 90 million annual budget, no government structure, but only HOA.
I have received many questions regarding the recent opinion request from our office and Delegate Jen Terrasa to the Maryland Attorney General’s Office concerning the removal of board members. I wanted to provide a brief update. Because there is currently pending litigation involving issues very similar to the questions that were raised, the Office of the Attorney General has indicated that it will not issue an opinion on the matter at this time.
In addition, I have been reviewing several broader issues that have emerged from recent community discussions regarding Columbia Association (CA) governance and accountability. As a result, I am considering potential legislation during the next legislative session, including:
1. Limit CA Executive Compensation
CA is a community association, not a private corporation. Executive compensation should be reasonable and comparable to similar public-sector leadership positions, such as county executives and other local government administrators.
I believe the current compensation level (415 thousand dollars, plus many perks, probably half million dollars in total) warrants further review. For reference: our governor salary is 192k. Howard County County executive salary is 244k. US president salary is 400k.
2. Clarify Nonprofit Board Governance
I am interested in clarifying under Maryland law whether nonprofit board members should be considered employees of the organization they serve or independent elected representatives of the membership. I don’t think they should be considered employee, especially for CA since they are elected by each village.
3. Protecting Homeowners from Rising Annual Charges
Many families living in CA communities are facing steadily increasing annual charges (tax). Current law allows CA to impose an annual charge of up to 75 cents per $100 of assessed property value. The current rate is approximately 68 cents per $100 of assessed value. I am considering legislation that would reduce the statutory cap from 75 cents to 68 cents in order to provide greater protection and predictability for homeowners.
As always, I welcome feedback from residents as I continue evaluating these issues.
Speakers: Congress, State, Local Officials, and Experts
Lunch will be provided
The Coalition for a National Infrastructure Bank, in conjunction with Congressman Danny Davis (D-Ill-7), is inviting Members and Staff to an important briefing on the National Infrastructure Bank Act (NIB) of 2025, H.R.5356. This bill has garnered extensive national support and has 60 Congressional Sponsors.
This briefing comes as the U.S. economy continues to fall. GDP is floundering around 2%, with some readings near zero. New job creation has been weak, with many months in negative territory. Inflation is escalating, and consumer sentiment is falling. The briefing intersects the current debate in Congress to reauthorize the Bipartisan Infrastructure Law.
H.R.5356 is a bold alternative. It will invest $5 trillion into the real, physical economy. It will REQUIRE NO NEW FEDERAL SPENDING OR FEDERAL TAXES! It will create millions of new, high-wage jobs! It has been used repeatedly in our nation’s history.
The NIB will complement whatever appropriations move through Congress. The historic Bipartisan Infrastructure Law is expiring now. With the federal budget deficit at $2 trillion per year, new discretionary spending is in jeopardy. The “Off-Budget” $5 trillion NIB will fill the gap.
H.R.5356 will invest in all areas of infrastructure. It will increase GDP to 5% per year, and make money for the government! What’s not to like?
Columbia Association Board removed three board members surprsingly
For a 10-member board, Colubmia Association annouced they removed three board members at the recommendation of their ethics panel. This is really surprising. The vote is 5-0-0 to get rid of three board members. I served on CA board before for four years and alway pay attention what’s happening. Such a dramatic situation never happened before.
I believe they need to have a public vote and they need 7 votes to pass such a resolution (2/3 of 10 votes). Furthermore they could not fire the village repreentative elected by each village.
Attached is the document shared by the current CA board.
Option 7 – Federal Contingency Planning and Grant Diversification
22
Section 6. Integrated Policy Packages
23
Package A – Spending-Focused Stabilization
23
Package B – Balanced Mix
24
Package C – Structural Reform + Growth
25
Section 7. Baseline vs. Policy Forecast
26
Section 8. Prioritization Matrix
30
Section 9. Final Recommendation
32
References
34
Executive Summary
The Bottom Line Maryland’s enacted fiscal 2027 budget is balanced on a cash basis, but it is not in durable structural balance. The Department of Legislative Services (DLS) projects a fiscal 2027 general fund structural shortfall of $598 million, rising to an estimated $2.57 billion in fiscal 2028 and $3.43 billion by fiscal 2030 under current law and current-services assumptions (DLS, 2026 90-Day Report, p. 26). DLS further reports that the structural gap widens sharply beginning in fiscal 2028 because Blueprint costs exceed dedicated Blueprint revenues and require nearly $2.6 billion of general fund support (DLS, 2026 90-Day Report, p. 27). Maryland therefore does not face an immediate cash insolvency problem; it faces a medium-term structural imbalance problem that will intensify quickly if the State relies on one-time balancing actions rather than recurring reforms.
The immediate fiscal position is tighter than Maryland’s reserve headline suggests. The enacted plan leaves an estimated fiscal 2027 closing cash balance of $201 million, in addition to a $2.2 billion Rainy Day Fund equal to 8.0% of estimated general fund revenues (DLS, 2026 90-Day Report, pp. 12, 26). That reserve posture is still credible, but it does not eliminate the underlying mismatch between ongoing revenues and ongoing spending. The core drivers of that mismatch are Maryland-specific: rising Blueprint and education commitments, Medicaid and disability-service cost growth, continued federal exposure equal to about 29.7% of all spending, and a revenue base tied to slower private-sector growth than several peer states.
Key Findings
Current structural position: DLS projects a fiscal 2027 structural shortfall of $598 million, even after the 2026 session’s enacted budget actions (DLS, 2026 90-Day Report, p. 26).
Out-year trajectory: DLS projects the structural deficit to widen to $2.57 billion in fiscal 2028 and $3.43 billion by fiscal 2030 under current law (DLS, 2026 90-Day Report, p. 26).
Blueprint pressure: DLS states that the gap grows substantially beginning in fiscal 2028 as Blueprint costs exceed Blueprint revenues and require nearly $2.6 billion of general funds (DLS, 2026 90-Day Report, p. 27).
Federal exposure: Federal funds account for approximately 29.7% of all fiscal 2027 spending, or about $21.1 billion, leaving Maryland unusually exposed to federal budget, grant, and procurement risk (DLS, 2026 90-Day Report, pp. 13, 50).
Reserve position: The enacted plan meets the Spending Affordability Committee target of an 8.0% Rainy Day Fund balance, with $2.2 billion in the Revenue Stabilization Account and a $201 million closing cash balance (DLS, 2026 90-Day Report, p. 26).
Gap-closing actions already taken: The 2026 session reduced the fiscal 2027 structural gap by 52% versus the December 2025 projection through $803.1 million in general fund reductions and $132.8 million in additional ongoing general fund revenue (DLS, 2026 90-Day Report, pp. 26, 31).
Top Policy Recommendations
1. Blueprint Sequencing Reform: Preserve the statutory framework while slowing or reordering the most fiscally intensive implementation steps beginning in fiscal 2028, when DLS shows the major structural widening begins.
2. Medicaid and Human Services Cost Management: Pursue managed-care contracting, eligibility integrity, behavioral-health reimbursement redesign, and disability-service efficiency rather than blunt eligibility cuts.
3. Revenue Base Modernization: Broaden selected tax bases and compliance tools instead of relying solely on higher headline rates on an already narrow and mobile base.
4. Administrative Consolidation and Procurement Reform: Focus on shared services, overlapping economic-development functions, licensing, and purchasing systems where savings are plausible and recurring.
5. Capital and Reserve Smoothing: Use reserve or debt-management tools only as a bridge and only alongside recurring reforms, not as a substitute for them.
6. Federal Risk Management: Build a standing fiscal-response process for federal grant, procurement, and workforce shocks given Maryland’s unusually high federal exposure.
7. Growth-Oriented Competitiveness Reform: Improve the long-run tax base through targeted business-climate, housing, commercialization, and labor-force actions that complement fiscal repair rather than compete with it.
Expected Results (5-Year Horizon, Package B Baseline)
Table 1. Expected Fiscal and Economic Outcomes Under a Balanced Policy Package
► Even under optimistic assumptions, full structural balance requires 4–5 years of sustained action.
Metric
FY2026 Baseline
FY2028 Policy (1-Yr)
FY2030 Policy (3-Yr)
FY2031 Policy (5-Yr)
Structural GF Gap
$598M shortfall
$1.4–2.0B
$0.7–1.4B
Near balance / manageable residual gap
Rainy Day Fund Balance
$2.2B (8.0%)
$1.9–2.1B (7%+)
$2.1–2.4B (7.5%+)
$2.3–2.8B (8%+)
GF Revenue Growth
3.0% ongoing revenue growth*
3.0–4.0%/yr
3.0–4.0%/yr
3.0–4.5%/yr
Ongoing Spending Growth
5.8% vs. FY2027 plan*
3.5–4.5%/yr
3.0–4.0%/yr
3.0–4.0%/yr
Competitiveness / Credit
AAA maintained; structural risk noted
AAA maintained if reforms enacted
stabilized outlook
stronger medium-term position
Section 1. Why Structural Deficits Matter
1.1 Cyclical vs. Structural Imbalance: A Critical Distinction
Not all budget gaps are equal. A cyclical shortfall arises when the economy contracts, temporarily depressing tax revenues and lifting demand for social services; it resolves as growth returns. A structural deficit persists even at full employment: it reflects a fundamental mismatch between the spending obligations a state has committed to and the revenue its tax base can sustainably generate. Maryland’s current gap is predominantly structural. DLS explicitly characterizes fiscal 2027 as ending with a structural shortfall of $598 million and fiscal 2028 with a structural deficit of $2.57 billion (DLS, 2026 90-Day Report, p. 26). The Blueprint’s escalating education spending, Medicaid’s trend growth, and other mandated costs do not abate when the economy improves. Revenue growth, meanwhile, is projected to average just 3.0% while ongoing spending grows 5.8% between fiscal 2027 and 2031 (DLS, 2026 90-Day Report, p. 27).
1.2 The Six Harms of Structural Deficits
Fiscal instability and reserve erosion: A structural deficit steadily draws down reserves, leaving the state exposed to revenue shocks. Maryland’s enacted fiscal 2027 plan leaves only a $201 million closing cash balance in addition to the 8% Rainy Day Fund target, which is adequate for short-term smoothing but not for repeated structural support (DLS, 2026 90-Day Report, p. 26).
Credit quality pressure: The three major rating agencies (Moody’s, S&P, Fitch) monitor structural balance as a primary credit factor. Maryland’s AAA rating—one of only 14 states to hold this designation as of May 2024—is a direct fiscal asset, saving tens of millions annually in borrowing costs. Persistent structural deficits put that rating at risk.
Reduced flexibility during downturns or federal cuts: A state entering a recession or federal funding reduction with structural imbalance has no cushion to absorb the shock. Maryland’s 29.7% federal fund dependency ($21.1 billion of $71.3 billion total enacted spending) makes this risk acute: the BRE 60-Day Report on the One Big Beautiful Bill (2026) flags potential federal cuts that could remove billions from Maryland’s budget with little notice.
Forced abrupt tax hikes or spending cuts: Without structural correction, Maryland will face an annual cycle of crisis-driven budget negotiations—raising taxes on a weakening base or cutting services that local governments, nonprofits, and vulnerable populations depend on.
Crowding out long-term investment: Capital investment in transportation, broadband, housing, and innovation infrastructure competes directly with structural spending obligations for general fund resources. When deficits dominate the budget conversation, long-term investments are deferred.
Institutional and political erosion: Recurring structural gaps breed short-termism in budget decisions, incentivize one-time fixes over genuine reform, and erode public and investor confidence in Maryland’s fiscal management.
1.3 Why This Matters Specifically for Maryland
Maryland’s structural deficit is compounded by three Maryland-specific factors that amplify the standard harms:
Blueprint obligations are statutory, not discretionary. The Blueprint for Maryland’s Future, enacted in 2021, is state law with defined funding schedules. These are not aspirational targets that can be quietly deferred—they carry legal, political, and accountability-board enforcement weight. Any phasing or sequencing strategy requires legislative action and AIB concurrence.
Federal exposure is uniquely high. With about $21.1 billion in federal funds representing 29.7% of enacted fiscal 2027 spending, Maryland is more exposed to federal fiscal decisions than most peers. Virginia (also high-dependency) benefits from a more diversified private tech sector. Maryland’s exposure is concentrated in health (Medicaid), education (Title I, IDEA), and defense contracting.
Private-sector growth has been systematically weak. Total nonfarm employment fell 1.9% year-over-year in early 2026, with professional and business services—the highest-wage private sector—down 4.3–4.9%. This directly suppresses income and corporate tax revenues, the core of the general fund. Unlike a cyclical shock, this reflects persistent structural competitiveness deficits that a growing deficit makes worse, not better.
Policy Implication Maryland cannot deficit-spend its way to growth. The fiscal and economic problems are mutually reinforcing: a structural deficit diverts capital from growth-enabling investment, while weak growth shrinks the tax base that could close the deficit. The policy agenda must address both sides simultaneously.
Section 2. Fiscal Baseline
2.1 General Fund Budget Overview (FY2026)
The enacted fiscal 2027 Maryland budget totals $71.314 billion across all fund sources. The general fund—the primary vehicle for unrestricted state spending and the central metric for fiscal health analysis—stands at $28.308 billion in appropriations. Federal funds total approximately $21.180 billion, or 29.7% of all spending. These figures come from the enacted budget totals in the 2026 90-Day Report, Exhibit A-1.15 (p. 50).
Table 2. FY2027 Maryland State Budget by Fund Source
Source: DLS, 2026 90-Day Report, Exhibit A-1.15, p. 50
► Federal funds at 29% represent Maryland’s most significant fiscal vulnerability.
Fund Source
FY2026 Appropriation
Share of Total
General Fund
$28.308 billion
39.7%
Federal Funds
$21.180 billion
29.7%
Special / Other Funds
$21.826 billion
30.6%
Total
$71.314 billion
100.0%
2.2 Revenue Trends
Maryland’s general fund revenues depend heavily on individual income taxes, sales taxes, general fund), corporate income taxes (≈8%), and sales and use taxes (≈20%). This concentration creates both strength and vulnerability:
Individual income tax: Maryland’s progressive income tax structure generates high per-capita collections ($3,177 per capita, ranked 4th nationally; Tax Foundation, 2026), but is highly sensitive to employment and income trends among high-earning households. Net domestic out-migration of higher-income taxpayers—documented in IRS migration data and Tax Foundation analysis (2026)—is measurably eroding this base. The top combined state-local marginal rate of up to 9.9% compares unfavorably with Virginia (5.75% flat top rate) and North Carolina (4.75% flat rate as of 2024).
Corporate income tax: Maryland’s 8.25% corporate income tax rate is among the highest in the mid-Atlantic region and limits business formation and headquarters retention. Virginia levies 6%, North Carolina 2.5% (reduced from 2.25% in 2024), and Pennsylvania 8.49% (in ongoing reduction).
Sales and use tax: Maryland’s 6% state sales tax applies narrowly. The exclusion of most services—while services now constitute over 70% of consumer spending—significantly constrains the sales tax base relative to economic activity. This structural narrowing suppresses revenue growth below GDP growth in normal years.
Revenue growth vs. spending growth mismatch: DLS projects ongoing revenues to grow at an average annual rate of 3.0% between fiscal 2027 and 2031, while ongoing spending grows 5.8% over the same period. That differential is the basic arithmetic behind the out-year structural gap (DLS, 2026 90-Day Report, p. 27).
2.3 Major Spending Drivers
The following five categories account for the large majority of general fund spending pressure over the next five years. Absent corrective action, these drivers will collectively consume virtually all projected revenue growth:
Table 3. Major Budget Pressure Points, FY2027 and Out Years
Source: DLS, 2026 90-Day Report, pp. 15, 17, 26-27, 47
► Blueprint education aid and Medicaid together account for the majority of out-year structural pressure.
Spending Category
FY2026 Estimated Cost
Annual Growth Rate
Notes
Blueprint Fund / K-12 aid
> $350M increase in FY2027
Steep step-up in FY2028
DLS says Blueprint costs exceed Blueprint revenues and require nearly $2.6B in GF beginning FY2028
Medicaid / health spending
> $225M federal Medicaid increase in FY2027
Continued upward pressure
DLS also cites $287.6M in GF within $718.3M of DDA/Medicaid-related support for prior-year costs
Personnel
$13.18B total funds
Ongoing salary and staffing pressure
17.7% of total FY2027 State budget (DLS, 2026 90-Day Report, p. 47)
Transportation / capital
$1.39B system preservation
Capital affordability pressure persists
DLS indicates transportation goals were met in FY2027 but capital choices remain constrained
Other mandated spending
Disability and formula aid growth
Upward out-year pressure
Budget rigidity limits flexibility once revenues soften
2.4 Reserve Position
The Spending Affordability Committee target for fiscal 2027 required both a closing cash balance of at least $100 million and a Rainy Day Fund balance of at least 8.0% of estimated general fund revenues. The enacted budget meets those tests with a projected $201 million closing cash balance and a $2.2 billion Rainy Day Fund balance (DLS, 2026 90-Day Report, p. 26).
The reserve picture is therefore mixed rather than immediately alarming. Maryland still has usable liquidity, but the small cash balance means the State has limited room to absorb a revenue miss or federal reduction without quickly returning to the legislature or drawing on reserves. In practical terms, the reserve position buys time; it does not solve the structural problem.
Section 3. Deficit Diagnosis
3.1 Cyclical vs. Structural Components
The Maryland structural deficit has both cyclical and structural components. The October–November 2025 federal government shutdown created a temporary drag estimated by BEA at approximately 1.0 percentage point of national real GDP growth in Q4 2025, with disproportionate impact on Maryland due to its federal worker and contractor concentration. This cyclical element will partially self-correct. (BEA GDP Third Estimate, Q4 2025, April 9, 2026)
However, the structural components are larger and more durable. DLS identifies the fiscal 2027 problem explicitly as a structural shortfall and shows the gap widening sharply in fiscal 2028 as Blueprint costs outrun dedicated revenues. The report’s baseline growth assumptions imply that the problem persists even without a recession. In other words, Maryland’s current vulnerability is not mainly that revenues could dip; it is that ongoing commitments are already set to grow faster than ongoing revenues.
Table 4. Maryland Structural vs. Cyclical Deficit Components (FY2026–FY2030)
Source: DLS, 2026 90-Day Report, pp. 26-27; author classification of sourced drivers
► Blueprint becomes the dominant structural pressure once dedicated Blueprint revenues are exhausted.
Component
FY2026 Gap Estimate
FY2028 Estimate
FY2030 Estimate
Type
Blueprint costs above Blueprint revenues
Driver emerges
Nearly $2.6B GF required
Major continuing driver
Structural
Medicaid / DDA / behavioral health
Ongoing pressure
Continued upward pressure
Continued upward pressure
Structural
Federal grant / procurement exposure
Tail risk
Material risk if federal cuts occur
Material risk if federal cuts persist
Mixed
Cyclical revenue weakness
Moderate
May fade with recovery
Uncertain
Cyclical
Total structural gap
$598M
$2.57B
$3.43B
—
3.2 Out-Year Structural Gap Trajectory
Under a current-services baseline—no policy changes, baseline economic growth, full Blueprint implementation on schedule—the structural general fund gap escalates as follows. These ranges reflect scenario uncertainty around federal cuts, revenue performance, and Medicaid caseloads. The lower bound assumes modest federal risk materialization; the upper bound assumes DOGE-level federal spending reductions affecting Maryland’s grant and contract revenues.
Table 5. Out-Year Structural Gap Trajectory (General Fund, Before Gap-Closing Actions)
Source: DLS, 2026 90-Day Report, pp. 26-27; FY2031 author extension based on DLS growth assumptions
► The sourced DLS forecast shows the structural gap widening by more than fivefold from FY2027 to FY2030.
Fiscal Year
Low Scenario
Mid Scenario (Base)
High Scenario
Key Driver
FY2027
$598M
$598M
$598M
Enacted budget after 2026 session actions
FY2028
$2.57B
$2.57B
$2.57B
Blueprint costs exceed Blueprint revenues
FY2029
$2.9B
$3.1B
$3.4B
Education and health cost growth; author scenario
FY2030
$3.43B
$3.43B
$3.43B
DLS out-year estimate
FY2031
$3.8B
$4.1B
$4.6B
Author extension using DLS revenue/spending growth rates
3.3 Risk Exposures
Federal Dependency Risk
Federal funds represent approximately $21.1 billion of Maryland’s $71.3 billion enacted fiscal 2027 budget, or 29.7% of all spending (DLS, 2026 90-Day Report, pp. 13, 50). Key federal funding streams at risk include:
Medicaid federal match (FMAP): Maryland’s federal medical assistance percentage typically covers 50%+ of Medicaid costs. Any FMAP reduction or work requirement that reduces enrollment will shift costs to the state general fund.
Education grants (Title I, IDEA, Head Start): These together represent several hundred million dollars annually. Federal grant consolidation or block grant conversion could reduce flexibility or total funding.
Defense and intelligence procurement: Fort Meade, NSA, the Applied Physics Laboratory (APL), and related contractors generate tens of billions in Maryland economic activity and indirect tax revenue. Procurement reductions at these facilities have immediate revenue and employment impacts.
Research grants (NIH, NSF, NIST): NIH, headquartered in Bethesda, Maryland, is the world’s largest funder of biomedical research and anchors Maryland’s life sciences cluster. FY2025 and early FY2026 reports of NIH grant freezes and headcount reductions threaten the $20+ billion in annual NIH-supported economic activity in Maryland.
Tax Base Erosion Risk
Tax Foundation migration data (2026) documents that Americans are moving to states with lower taxes and more competitive structures. Maryland has experienced consistent net domestic out-migration, primarily to Virginia, Florida, Pennsylvania, and the Carolinas. IRS Statistics of Income data show that Maryland loses a disproportionate share of high-income filers—the same taxpayers who generate the majority of income tax revenue. This creates a self-reinforcing cycle: the high-income taxpayer base shrinks, the remaining base must be taxed at higher rates to maintain revenue, which further accelerates out-migration.
Section 4. Comparative Analysis with Peer States
Peer state comparisons are most useful when they reveal specific lessons Maryland can apply, not when they simply rank states on aggregate indices. The four peer states— Virginia, North Carolina, Pennsylvania, and New Jersey—each offer distinct lessons for Maryland’s fiscal strategy.
Table 6. Maryland Fiscal and Economic Comparison with Peer States
► North Carolina’s decade of tax simplification has produced stronger growth and budget resilience.
Indicator
Maryland
Virginia
North Carolina
Pennsylvania
New Jersey
Top State Income Tax Rate
5.75%*
5.75%
4.75%
3.07% (flat)
10.75%
Corporate Income Tax Rate
8.25%
6.00%
2.50%
8.49%→4.99%
9.00%
State Tax Competitiveness Rank (2026)
46th
~25th
~10th
~32nd
~49th
State-Local Tax Burden (% income)
11.3%
~9.3%
~8.9%
~10.1%
~13.2%
Rainy Day Fund (% of GF)
~8.8%
~10–12%
~15–18%
~10%
~5%
2025 Real GDP Growth (est.)
~1.5–2.0%
~2.5–3.0%
~3.5–4.0%
~2.0–2.5%
~2.0–2.5%
Unemployment Rate (Jan 2026)
4.3%
~3.2%
~3.7%
~3.9%
~4.5%
Federal Funds Share of Budget
~29%
~25%
~27%
~32%
~26%
Primary Structural Challenge
Blueprint + federal
Pension growth
Revenue sufficiency
Pension/OPEB legacy
Debt + spending
* Maryland’s top combined state-local rate reaches up to 9.9% with county income taxes.
4.1 Virginia: The Most Direct Competitor
Virginia’s fiscal position is instructive for Maryland in two ways. First, Virginia carries a structurally similar income-tax-heavy revenue mix but has maintained stronger private-sector job growth (unemployment ~3.2% vs. Maryland’s 4.3%), partly reflecting its more competitive 6% corporate tax rate, less regulatory friction, and lower combined income tax burden at most brackets. Second, Virginia actively competes with Maryland for major corporate headquarters, data centers, and federal-adjacent contractors—Amazon HQ2 and numerous defense tech firms chose Northern Virginia over Maryland in part due to tax and regulatory considerations. Maryland cannot match Virginia on tax rates without significant revenue trade-offs, but can narrow the gap on targeted business investments and regulatory speed.
4.2 North Carolina: A Growth Model with Structural Lessons
North Carolina has undergone the most dramatic fiscal transformation among mid-Atlantic and southeastern peers over the past decade. Beginning with a 6.9% top income tax rate in 2013, North Carolina has reduced its flat rate to 4.75% (with further reductions planned), lowered its corporate tax toward zero by FY2030 under current law, and broadened its sales tax base to offset revenue losses. The result: North Carolina consistently ranks in the top 10 on tax competitiveness, real GDP growth of approximately 3.5–4.0% annually, and a Rainy Day Fund at 15–18% of general fund appropriations. The lesson for Maryland is not to replicate North Carolina’s rate cuts immediately—Maryland’s fiscal position cannot bear that—but to adopt the sequenced approach: broaden first, then reduce rates as the base grows.
4.3 Pennsylvania: A Pension Warning
Pennsylvania‘s fiscal trajectory offers a cautionary example of deferred pension obligations compounding into a structural crisis. Pennsylvania’s pension debt forced a decade of difficult choices between tax increases and service cuts. Maryland’s pension system (estimated 65.7% funded as of FY2024, MSRPS estimates) is healthier than Pennsylvania’s at the onset of its crisis, but the direction matters: insufficient annual contributions today create larger obligations tomorrow. Maryland’s Act 2011 pension reform reduced future accruals, but OPEB liabilities remain large. Pennsylvania’s lesson: address unfunded liabilities before they compound.
4.4 New Jersey: High-Tax Instability
New Jersey represents the path Maryland should avoid. With the highest combined tax burden in the region (13.2% of income), a 9% corporate tax rate, and ranked last or near-last on tax competitiveness, New Jersey has experienced persistent out-migration, structural deficits, and multiple credit downgrades. New Jersey’s repeated reliance on short-term revenue measures (lottery monetization, pension payment deferrals, one-time federal funds) rather than structural reform has left it with minimal fiscal flexibility and a Rainy Day Fund below 5% of general fund. Maryland’s current trajectory—high taxes, growing mandated spending, weak growth, thin reserves—bears more resemblance to New Jersey than Maryland’s policymakers should be comfortable acknowledging.
Section 5. Policy Options to Close the Gap
The following seven policy options span spending restraint, revenue broadening, government operations, reserve management, and growth-oriented reform. Each is analyzed for fiscal effect, structural value, economic impact, and implementation feasibility. Options are presented as distinct and non-repetitive; the integrated packages in Section 6 combine them for maximum cumulative effect.
Option 1. Blueprint Cost Management and Phased Sequencing
Negotiate with the Accountability and Implementation Board (AIB) to sequence Blueprint components by readiness and cost-effectiveness, deferring high-cost elements (full teacher salary scale; universal pre-K expansion at planned pace) by 2–3 years while accelerating high-return elements (career and technical education; college prep concentrations; curriculum alignment).
Why considered
Blueprint annual incremental costs are projected at $300–500 million per year through FY2030, totaling $2.5–3.2 billion in cumulative general fund obligation above the FY2023 baseline. This is the single largest driver of the structural gap.
Fiscal effect (1-yr)
Save $400–700 million in general fund outlays in FY2029 (relative to current schedule, if enacted January 2028).
Fiscal effect (3-yr)
Cumulative savings of $1.2–2.0 billion, while preserving the long-term Blueprint framework and statutory commitment.
Fiscal effect (5-yr)
Savings of $2.0–3.0 billion vs. baseline; structural gap reduced by 30–45% of the total.
Type
Recurring; addresses structural gap directly.
Structural value
High. Directly targets the largest structural spending driver.
Economic impact
Neutral to modestly negative short-term (slower teacher salary growth); positive long-term if sequencing prioritizes high-return investments.
County/local impact
Significant: counties bear 40–50% of Blueprint costs under local share formulas. Sequencing relief flows proportionally to county budgets. MACo has consistently identified Blueprint local cost exposure as a top fiscal concern.
Implementation req.
Requires legislative amendment to Blueprint timelines; AIB concurrence; MSDE planning revision. Complex but precedented—AIB has already made phasing adjustments.
Political feasibility
Moderate. Faces teacher union and advocacy opposition; however, broad fiscal pressure and county government support may create a coalition for responsible sequencing.
Risks & tradeoffs
Risk of being characterized as ‘gutting’ the Blueprint. Must be framed as evidence-based sequencing, not abandonment. International evidence (McKinsey, OECD) supports that teacher quality and curriculum matter more than pace of salary escalation in early reform phases.
Option 2. Medicaid Program Integrity and Managed Care Reform
Expand value-based payment contracts with Maryland’s Medicaid managed care organizations (MCOs); implement enhanced fraud and abuse detection using data analytics; streamline eligibility redetermination to reduce improper enrollment; and expand integrated care models for dual-eligible (Medicare/Medicaid) populations.
Why considered
Medicaid consumes approximately $6.5–7.0 billion (all funds) in FY2026 and grows at 6–7% annually. The GF share (≈50%) means every 1% saved on Medicaid saves approximately $32–35 million in general fund. OIG audits and CMS program integrity reports consistently identify improper payments and care-delivery inefficiencies as addressable.
Fiscal effect (1-yr)
$100–200 million GF savings from enhanced integrity and targeted managed care renegotiation.
Fiscal effect (3-yr)
$300–500 million cumulative; larger savings from value-based contract maturation.
Fiscal effect (5-yr)
$600–900 million cumulative; dual-eligible integration and prevention models reduce acute care utilization.
Type
Recurring; grows over time as reforms mature.
Structural value
High for long-term Medicaid trend; moderate for near-term gap.
Economic impact
Positive: reduces burden on business through employer-sponsored insurance substitution; improves population health and workforce productivity.
County/local impact
Mostly positive for counties; improves health outcomes in Baltimore City and rural Eastern Shore where Medicaid enrollment is highest.
Implementation req.
DHMH administrative action; CMS waiver amendment for some elements; MCO contract renegotiation. Complex but within existing state authority.
Political feasibility
High. Managed care reform and fraud reduction have broad bipartisan support. Politically difficult only if managed care organizations resist.
Risks & tradeoffs
Savings estimates are inherently uncertain. Managed care efficiencies may be offset by adverse selection or sicker populations in value-based models. CMS federal policy changes (work requirements) could increase uncompensated care costs if enrollment drops.
Expand Maryland’s 6% sales tax to selected business-to-business services (accounting, legal, IT consulting) and close the digital goods tax gap (streaming, software-as-a-service). Alternatively or additionally: modernize the tobacco and cannabis tax structure and close the limited-liability company pass-through income tax gap identified in DLS fiscal reviews.
Why considered
Maryland’s sales tax base has structurally narrowed as the economy shifted to services. Over 30 states tax at least some services. A 6% tax on business services generates significant revenue while distributing burden across the business community rather than households. The digital goods gap is estimated at $200–400 million annually in foregone revenue.
Fiscal effect (1-yr)
$300–500 million in new recurring GF revenue.
Fiscal effect (3-yr)
$900M–1.5B cumulative.
Fiscal effect (5-yr)
$1.5–2.5B cumulative; revenue grows with economic activity.
Type
Recurring; structurally broadens the tax base.
Structural value
High; the most durable revenue option available.
Economic impact
Moderate negative for business-service intensive sectors. Tax Foundation’s analysis (2026) suggests sales tax base broadening has smaller economic efficiency costs than rate increases on income. Risk: business location decisions if Virginia does not adopt similar taxes.
County/local impact
Positive: additional revenue supports county-shared revenues and reduces pressure on local property taxes.
Implementation req.
Legislative action; Comptroller regulatory guidance; 2–3 year phase-in recommended to allow business adjustment.
Political feasibility
Moderate. Business community will oppose; however, framing as ‘modernization’ rather than ‘new taxes’ and pairing with modest rate adjustments can build a coalition. Six states adopted service tax expansions between 2020–2025.
Risks & tradeoffs
Virginia’s non-adoption creates competitive pressure for professional services firms. Risk of business relocation is real but modest for in-state service providers. Must be paired with a competitiveness offset (see Option 6).
Option 4. Agency Consolidation and Administrative Efficiency
Source: DBM Efficiency Review (2023); DLS Analysis of the Maryland Executive Budget; Pew Charitable Trusts (2024)
Dimension
Assessment
What it is
Conduct a systematic review of Maryland’s 77+ cabinet and independent state agencies to identify consolidation opportunities, shared-services migrations, and duplication. Priority targets: overlapping economic development functions (Commerce, MEDCO, TEDCO, CASA, DBED remnants); licensing boards; and information technology procurement across agencies.
Why considered
Maryland operates one of the larger state agency structures in the mid-Atlantic relative to population size. Administrative overhead, duplicated back-office functions, and siloed IT systems cost hundreds of millions annually above efficient-scale benchmarks. A 2023 DBM efficiency review identified $150–250 million in near-term administrative savings without service cuts.
Fiscal effect (1-yr)
$80–150 million in administrative savings (position attrition, IT consolidation, procurement renegotiation).
Fiscal effect (3-yr)
$250–400 million cumulative.
Fiscal effect (5-yr)
$400–700 million cumulative; larger IT and shared-service savings materialize.
Type
Recurring, though front-loaded with one-time transition costs.
Structural value
Moderate. Administrative savings alone cannot close the gap, but improve government effectiveness and fiscal credibility.
Economic impact
Neutral to positive; more efficient government reduces business compliance costs and improves service delivery speed.
County/local impact
Mixed. Some county-administered state programs benefit from clearer agency mandates; some county pass-through funding may be affected by renegotiated state-agency contracts.
Implementation req.
Governor’s executive authority for most agency restructuring; legislative action for statutes defining certain board/commission functions; 12–24 months to achieve meaningful savings.
Political feasibility
Moderate. State employee unions will resist headcount reductions; but framing around service improvement and position attrition (rather than layoffs) reduces opposition.
Risks & tradeoffs
Transition costs can temporarily increase spending. Savings estimates from efficiency reviews are often optimistic; apply a 60–70% confidence discount to gross estimates. Do not project large savings without confirmed plans.
Option 5. Strategic Reserve Deployment and Debt Restructuring
Authorize a time-limited draw of up to $500 million from the Rainy Day Fund to bridge the structural gap while structural reforms take effect—conditioned on concurrent enactment of at least $1.5 billion in recurring gap-closing measures. Simultaneously, restructure the capital debt service schedule to shift near-term payments and reduce general fund pressure by $100–200 million in FY2028–FY2029.
Why considered
The Rainy Day Fund exists precisely to smooth structural transitions. A one-time bridge is prudent if—and only if—it is paired with structural solutions. Without the conditionality, reserve use merely defers the problem. The Spending Affordability Committee and DLS have both cautioned against reserve drawdowns absent structural reform.
Fiscal effect (1-yr)
$500–700 million in near-term general fund relief (reserve draw + debt restructuring).
Fiscal effect (3-yr)
Bridge exhausted; must be replaced by structural savings from Options 1–4. Net effect depends on reform enactment.
Fiscal effect (5-yr)
Neutral if structural measures are enacted; negative if used as a substitute for reform.
Type
One-time bridge; not a structural solution.
Structural value
Low on its own; High as a complement to structural reform.
Economic impact
Positive short-term (avoids abrupt cuts); neutral to negative if overused (signals fiscal weakness to rating agencies).
County/local impact
Positive: prevents abrupt cuts to state aid that counties depend on for school and health funding.
Implementation req.
Legislative appropriation with conditionality language; replenishment plan required within 3 years by statute.
Political feasibility
High. Reserve use in a genuine structural crisis has bipartisan support; the key is the conditionality requirement.
Risks & tradeoffs
If structural reforms are not enacted simultaneously, reserve draw depletes fiscal cushion and triggers credit concern. Moody’s and S&P have noted Maryland’s thin operating margin; a large reserve draw without structural action would increase AAA rating downgrade risk.
Option 6. Tax Competitiveness Reform for High-Income Earners
Source: Tax Foundation (2026); IRS Statistics of Income Migration Data; Comptroller BRE
Dimension
Assessment
What it is
Raise the income threshold at which Maryland’s top combined state-local marginal rate (up to 9.9%) applies; reduce or rationalize the marginal rate schedule above $500,000 in taxable income; and eliminate the estate/inheritance tax on estates below $10 million. Pair with the revenue broadening in Option 3 to maintain overall revenue neutrality or modest net gain.
Why considered
Maryland’s combined 9.9% top rate is among the highest in the eastern US. Tax Foundation migration data (2026) confirms that net out-migration of high-income earners to Florida, Virginia, and the Carolinas has been persistent and income-tax-rate sensitive. Maryland also has both an estate tax ($5M threshold) and an inheritance tax—one of only a small number of states to levy both—which accelerates the exit of retirees and wealth holders.
Fiscal effect (1-yr)
Near-term revenue cost of $200–350 million GF from rate reduction and estate threshold increase.
Fiscal effect (3-yr)
Revenue impact narrows as retention effects materialize; net cost $300–500 million cumulative but partially offset by reduced out-migration.
Fiscal effect (5-yr)
If paired with base broadening (Option 3), near revenue neutrality or modest net positive as retained taxpayers generate income, sales, and capital gains tax through economic activity.
Type
Recurring; long-term structural improvement to competitiveness.
Structural value
High for long-term tax base strength; near-term cost.
Economic impact
Positive: reduces incentive for high-income household departure; encourages business formation and headquarters retention; reduces capital exit.
County/local impact
Mixed short-term (county piggyback rates affected); positive long-term as high-income retention improves county tax bases.
Implementation req.
Legislative action; Comptroller regulatory updates; requires concurrent base broadening to maintain revenue adequacy.
Political feasibility
Difficult. Opposition from progressive caucus viewing this as a tax cut for the wealthy. Must be framed in terms of net-revenue and competitiveness evidence, paired with base broadening, and focused on rate thresholds rather than absolute rate cuts.
Risks & tradeoffs
Behavioral response (retention effect) takes 3–5 years to fully materialize. Near-term revenue cost is certain; long-term benefit is probabilistic. This option should not be adopted without concurrent base broadening.
Option 7. Federal Contingency Planning and Grant Diversification
Table 13. Option 7: Federal Contingency Planning — Analysis Summary
Establish a Federal Funding Risk Office within DBM/BRE to provide real-time monitoring of federal grant and contract exposure; require agencies to develop 12-month contingency plans for a 10% federal funding reduction; and accelerate the diversification of federally dependent programs (particularly Medicaid administration, NIH-linked research, and DSHA housing programs) toward state-funded or private-partnership models.
Why considered
With $19.5 billion in federal funds at stake and active federal budget reduction efforts under DOGE and related initiatives, Maryland is uniquely exposed. The BRE 60-Day Report (2026) on the One Big Beautiful Bill highlights potential Maryland-specific federal spending impacts in the multi-billion-dollar range. No state agency currently has a formal federal-contingency planning mandate.
Fiscal effect (1-yr)
Minimal direct savings; avoidance of unplanned mid-year cuts worth $200–500 million if federal reductions materialize.
Fiscal effect (3-yr)
Contingency diversification reduces federal dependency by an estimated 3–5 percentage points; avoidance value $500 million–$1 billion over the period.
Fiscal effect (5-yr)
Structural reduction in federal dependency from 29% to 24–26% of total budget is achievable; avoidance value depends on actual federal policy trajectory.
Type
Operational/administrative; recurring benefit.
Structural value
Moderate-High. Reduces a major tail risk to the fiscal baseline.
Economic impact
Positive: diversification of research and housing funding reduces volatility in key sectors; NIH anchor role can be strengthened through state research-matching programs.
County/local impact
Significant positive for Baltimore City and surrounding counties where federal grant dependency is highest in social services and housing.
Implementation req.
Executive order plus legislative appropriation for Risk Office ($5–10 million/yr); no statutory barrier; 6-month implementation timeline.
Political feasibility
High. Risk management framing has strong bipartisan support; it does not require new taxes or spending cuts.
Risks & tradeoffs
Diversification may require higher state spending to replace federal programs. The goal is managed reduction, not abrupt elimination. Maryland’s research institutions depend on federal funding; diversification must be careful not to reduce R&D investment that anchors the innovation economy.
Section 6. Integrated Policy Packages
The seven options in Section 5 are most effective when combined into coherent packages that address spending, revenue, and operations simultaneously. Three packages are presented below—Spending-Focused (Package A), Balanced Mix (Package B), and Structural Reform + Growth (Package C)—each reflecting a different political and fiscal strategy.
Table 14. Comparison of Three Integrated Policy Packages
Source: Author analysis; based on DLS fiscal projections and peer-state experience
► Package B is the most balanced and most likely to achieve durable fiscal stabilization.
Package A relies primarily on spending restraint: phased Blueprint sequencing (Option 1), Medicaid managed care reform (Option 2), and agency consolidation (Option 4), with limited reserve use (Option 5, capped at $250 million) and no new taxes. This package is the most politically viable in the near term, as it avoids new revenue measures. However, it faces implementation risk because the spending savings—particularly from Blueprint phasing—require legislative action and AIB concurrence. If savings targets are not met, the package delivers only $600–900 million in year one instead of the projected $1.0–1.5 billion.
Service implications: Package A requires restraint in K-12 education expansion pace, Medicaid provider rate growth, and state agency headcount. Counties will experience slower state aid growth, increasing pressure on local property tax rates. Without a revenue component, Package A does not improve Maryland’s tax competitiveness and leaves the structural revenue weakness unaddressed.
Package B: Balanced Mix (Recommended Baseline)
Package B combines Blueprint sequencing (Option 1), Medicaid reform (Option 2), targeted revenue broadening (Option 3), administrative efficiency (Option 4), a limited reserve bridge (Option 5, capped at $400 million with conditionality), and federal contingency planning (Option 7). This package addresses the deficit from both sides—spending and revenue—and builds institutional resilience. Estimated gap closure of 55–75% over five years, assuming full enactment by January 2028, is the most realistic achievable scenario under current political and economic conditions.
Package B is the primary basis for the Baseline vs. Policy Forecast in Section 7. It is recommended as the foundation for FY2028 budget planning.
Package C: Structural Reform + Growth
Package C is the most ambitious and highest-risk option. It combines all seven options, including the tax competitiveness reform (Option 6), and requires concurrent base broadening and rate rationalization. Package C is most likely to produce durable long-term fiscal balance and improved economic performance, but its implementation risk is highest: it requires legislative supermajority support, business and advocacy coalition-building, and sustained multi-year execution. For a state facing a near-term crisis, Package C’s slow near-term payoff is a significant drawback; however, its long-term economic and fiscal dividends are substantially larger than Package A or B.
Section 7. Baseline vs. Policy Forecast
The following projections assume Package B is enacted in January 2028, with implementation of Blueprint phasing (Option 1), Medicaid reform (Option 2), revenue broadening (Option 3), and administrative efficiency (Option 4) beginning in FY2028. Reserve bridge (Option 5) is deployed in FY2028–FY2029. Federal contingency planning (Option 7) begins immediately upon enactment. All estimates are directional ranges; avoiding false precision is intentional.
Projection Assumptions and Limitations Baseline uses the enacted DLS structural-gap outlook where available: $598 million in fiscal 2027, $2.57 billion in fiscal 2028, and $3.43 billion in fiscal 2030. For years beyond the published DLS table, this report uses scenario ranges built from DLS’s statement that ongoing revenues grow about 3.0% annually while ongoing spending grows 5.8% from fiscal 2027 through 2031 (DLS, 2026 90-Day Report, p. 27). Policy scenario assumes all Package B measures are enacted by January 2028 and implemented with moderate success. Federal funding changes are treated as a risk range, not a point estimate. Projections extend only 5 years (FY2033) due to compounding uncertainty beyond that horizon.
7.1 General Fund Structural Gap
Table 15. General Fund Structural Gap: Baseline vs. Package B Policy Scenario
Source: DLS, 2026 90-Day Report, pp. 26-27; author scenario analysis for FY2029-FY2033
► Package B is modeled as materially reducing, but not automatically eliminating, the structural gap within five years.
Fiscal Year
Baseline Gap (Low–High)
Policy Scenario Gap (Low–High)
Improvement vs. Baseline
FY2027 (current enacted)
$598M
$598M
— pre-enactment
FY2028 (enactment year)
$2.57B
$2.1–2.4B
$0.2–0.5B improvement
FY2029 (yr 1 policy)
$2.9–3.4B
$1.9–2.6B
$0.8–1.4B improvement
FY2031 (yr 3 policy)
$3.8–4.6B
$1.4–2.4B
$2.0–2.7B improvement
FY2033 (yr 5 policy)
$4.4–5.5B
$0.8–1.8B
$3.0–4.2B improvement
7.2 Reserve Position
Table 16. Reserve Position: Baseline vs. Policy Scenario
► * Includes $400M reserve bridge draw in FY2028; replenishment begins FY2030.
Fiscal Year
Rainy Day Fund (Baseline)
Rainy Day Fund (Policy)
GF Closing Balance (Baseline)
GF Closing Balance (Policy)
FY2027
$2.2B (8.0%)
$2.2B (8.0%)
$201M
$201M
FY2028
$1.9–2.1B (6.8–7.5%)
$1.8–2.0B (6.5–7.2%)*
$50–150M
$150–350M
FY2030
$1.4–1.9B (5–7%)
$1.9–2.3B (7%+)
Minimal
$250–600M
FY2033
$0.9–1.5B (3–5%)
$2.1–2.7B (7.5%+)
Persistent pressure
$300–800M
Under the baseline (no major policy change), Maryland can preserve reserves for a time, but doing so becomes increasingly difficult as the structural gap widens after fiscal 2028. Under Package B, the reserve is used more explicitly as a smoothing device while recurring measures are phased in, improving the odds that the State maintains an investment-grade reserve posture rather than drifting into serial one-time balancing.
7.3 Revenue Trajectory
Table 17. General Fund Revenue Trajectory: Baseline vs. Policy Scenario
► * Policy uplift in FY2028 reflects revenue-base broadening and compliance measures under Option 3.
Fiscal Year
GF Revenue (Baseline)
GF Revenue (Policy)
Revenue Growth (Baseline)
Revenue Growth (Policy)
FY2027
Indexed at 100
Indexed at 100
—
—
FY2028
103
104-105
~3.0%
~4.0-5.0%*
FY2030
109
113-116
~3.0%
~3.5-4.5%
FY2033
119
127-134
~3.0%
~3.5-4.5%
7.4 Employment and Wages
Table 18. Employment Outlook: Baseline vs. Policy Scenario
Source: BLS Maryland Economy at a Glance (Jan 2026); Author projections
► Policy scenario improvements are driven primarily by tax competitiveness and federal-contingency stabilization.
Indicator
FY2026 Current
FY2028 Baseline
FY2028 Policy
FY2030 Policy
FY2033 Policy
Total Nonfarm Employment (000s)
~2,789
~2,740–2,780
~2,790–2,830
~2,870–2,940
~3,000–3,080
12-mo Employment Change
(1.9%)
(0.5–1.0%)
0.5–1.0%
1.5–2.0%
2.0–2.5%
Unemployment Rate
4.3%
4.0–4.5%
3.8–4.2%
3.5–4.0%
3.2–3.7%
Private Sector Wage Growth (est.)
~2.0%
~2.5%
~3.0%
~3.5%
~4.0%
7.5 Competitiveness and Business Activity
Under the baseline, Maryland’s 46th-place tax competitiveness ranking (Tax Foundation 2026 State Tax Competitiveness Index) remains unchanged or deteriorates as other states continue reforming their tax structures. Net domestic out-migration of high-income households persists, with an estimated net loss of 5,000–8,000 high-income filers annually. Business formation rates remain below pre-2017 levels.
Under Package B (with Option 6 added in Package C), Maryland’s competitiveness ranking could improve to the 35th–40th range by FY2030, driven by base broadening (which is competitively neutral or positive), administrative efficiency (which reduces effective compliance costs), and federal-contingency stabilization (which reduces business and investor uncertainty). Net out-migration slows to 2,000–4,000 high-income filers annually by FY2030. Business formation rates return to 2016–2018 trend levels.
7.6 County and Local Fiscal Effects
Maryland’s counties and Baltimore City are directly affected by the state deficit through three channels: (1) state aid levels for education and health, (2) county income tax piggyback revenues, and (3) Blueprint local cost-share obligations.
County effects are directionally clear even where precise out-year amounts vary. DLS and county fiscal commentary indicate that local governments face modest revenue growth alongside rising cost pressure from state policy choices, federal reductions, and Blueprint-related obligations. Under the baseline, those pressures increase reliance on local property tax and fee decisions. Under Package B, Blueprint sequencing and better state fiscal alignment reduce the likelihood that the State pushes adjustment costs disproportionately onto counties.
Section 8. Prioritization Matrix
The matrix below ranks the seven policy options by expected fiscal impact and implementation feasibility, distinguishing near-term wins, medium-term reforms, and long-term structural shifts. Impact scores reflect estimated recurring annual fiscal value at year 3. Feasibility scores reflect political, administrative, and legal complexity.
► Options 2 (Medicaid), 1 (Blueprint), and 7 (Federal Contingency) offer the best composite scores.
Option
Category
Est. Recurring Value (Yr 3)
Impact Score (1–10)
Feasibility Score (1–10)
Composite (Impact × Feas.)
Timeline
Priority
1. Blueprint Phasing
Spending
$600M–$1.0B/yr
9
6
54
Medium-term
★★★★★
2. Medicaid Reform
Spending
$300–500M/yr
7
8
56
Near-term
★★★★★
3. Revenue Broadening
Revenue
$400–600M/yr
8
6
48
Medium-term
★★★★
4. Agency Consolidation
Operations
$150–300M/yr
5
7
35
Near-term
★★★
5. Reserve Bridge
Bridge
$400–700M one-time
4
9
36
Near-term
★★★
6. Tax Competitiveness
Revenue/Growth
Net cost near-term; +$200–400M/yr yr5+
8 (long-term)
4
32
Long-term
★★★
7. Federal Contingency
Risk Mgmt
$200–500M avoidance
6
9
54
Near-term
★★★★★
8.1 Near-Term Wins (FY2027–FY2028)
Option 2 (Medicaid Reform): Highest composite score; within existing state authority; bipartisan; first savings visible in 12–18 months.
Option 7 (Federal Contingency Planning): Lowest cost to implement; highest political feasibility; risk-avoidance value is substantial given current federal environment.
Option 4 (Agency Consolidation): First tranche of savings via attrition and IT rationalization achievable within 18 months.
Option 5 (Reserve Bridge): Deploy in FY2028–FY2029 only if concurrent structural reforms are enacted; treat as a bridge, not a solution.
8.2 Medium-Term Reforms (FY2028–FY2030)
Option 1 (Blueprint Phasing): Largest single savings opportunity; requires legislative action and AIB engagement; most impactful medium-term measure.
Option 3 (Revenue Broadening): Requires careful design and phase-in to avoid competitiveness harm; recommended paired with Option 6 preparation.
8.3 Long-Term Structural Shifts (FY2030+)
Option 6 (Tax Competitiveness Reform): Most transformative for long-run growth and tax base quality; requires political will and concurrent base broadening. Begin design in FY2027 legislative session.
Summary Ranking for Policymakers If forced to choose three immediate priorities: (1) Begin Medicaid managed care reform immediately—highest near-term impact, lowest political risk. (2) Establish the Federal Funding Risk Office immediately—free option against a major risk. (3) Introduce Blueprint phasing legislation in FY2027 session—the most consequential medium-term action, with the largest structural value.
Section 9. Final Recommendation
9.1 Core Strategic Judgment
Maryland’s structural deficit is real, growing, and dangerous. It is not primarily a revenue problem or a spending problem in isolation—it is a structural alignment problem: spending obligations were designed and enacted under assumptions about economic growth and federal support that have not materialized. Closing the gap requires action on both sides, structured over a realistic 4–5 year reform timeline, with near-term bridging measures to prevent service disruption.
The most important policy insight from the analysis is this: actions that improve Maryland’s long-run economic growth rate are worth significantly more than equivalent one-time savings, because they permanently expand the tax base on which all future budgets depend. Exact Maryland yield estimates are uncertain, but the policy direction is not: a broader and faster-growing private tax base reduces the need for repeated rate increases or emergency cuts. Growth and fiscal repair are not in tension; they are the same strategy pursued from different angles.
9.2 Recommended Action Sequence
Table 20. Recommended Action Sequence
Source: Author recommendation; DLS; DBM
► Speed matters because DLS shows the structural gap widening sharply beginning in fiscal 2028.
Timeline
Action
Lead
Expected Fiscal Value
Immediately (2026)
Establish Federal Funding Risk Office
DBM / BRE
Risk avoidance; $0 direct cost
Immediately (2026)
Begin Medicaid MCO renegotiation and integrity program
Reserve bridge draw, conditioned on legislative enactment of recurring measures
BdPW / MGA
One-time: $300–400M
FY2028–2029
Begin design of tax competitiveness reform for FY2030 enactment
Governor / Comptroller / MGA
Long-term: +$200–400M/yr by FY2033
9.3 Conditions for Success
Political discipline: The structural deficit cannot be closed without some combination of restrained spending growth and new revenues. Any package that relies exclusively on one side is either fiscally inadequate or politically unsustainable.
Institutional credibility: The BRE, DLS, and AIB must all be involved in the annual validation of savings and revenue projections. One-time measures must be clearly labeled as such; recurring measures must be confirmed as such. The General Assembly’s Budget Committees should require annual structural-balance reporting.
Reserve protection: The Rainy Day Fund draw in Option 5 must be conditioned on concurrent enactment of recurring gap-closing measures. The Board of Public Works and the Spending Affordability Committee should have joint oversight of the conditionality.
Economic growth as a co-equal priority: No fiscal repair plan will succeed if Maryland’s private-sector employment continues to contract. The Governor should treat business climate reform, innovation ecosystem investment, and federal-contingency planning as fiscal strategies, not merely economic development aspirations.
County partnership: MACo and county governments must be partners in Blueprint phasing and Medicaid reform—not adversaries. The local fiscal impact of state decisions is large enough that county opposition to reforms can derail the legislative agenda.
9.4 The Cost of Inaction
What Happens If Nothing Changes Under the current-services baseline—no major policy reforms, Blueprint on schedule, federal funding at current levels—the DLS forecast already shows the structural shortfall rising from $598 million in fiscal 2027 to $2.57 billion in fiscal 2028 and $3.43 billion by fiscal 2030. Beyond that point, the most plausible baseline is continued widening pressure, heavier reliance on one-time actions, and growing conflict over whether to cut services, raise taxes, slow Blueprint implementation, or push costs to counties.
The precise endpoint depends on economic growth and federal policy, so this report does not present a false-precision worst case. But the direction of risk is clear and documented: without recurring reforms, the State’s room for maneuver narrows quickly. The choices before the Governor and General Assembly are consequential and time-sensitive.
References
1. Bureau of Economic Analysis (BEA), 2026. GDP (Third Estimate), Industries, Corporate Profits, State GDP, and State Personal Income, 4th Quarter and Year 2025. BEA News Release BEA 26-19, April 9, 2026. Available at: http://www.bea.gov
2. Bureau of Labor Statistics (BLS), 2026. Maryland Economy at a Glance. Mid-Atlantic Information Office. January 2026 data, retrieved April 2026. Available at: http://www.bls.gov/regions/mid-atlantic/maryland.htm
3. Maryland Department of Legislative Services (DLS), 2026. Effect of the 2025 Legislative Program on the Financial Condition of the State. Annapolis, MD: DLS.
4. Maryland Department of Legislative Services (DLS), 2026. Fiscal Briefing 2026. Annapolis, MD: DLS. Available at: dls.maryland.gov/pubs/prod/RecurRpt/Fiscal_Briefing_2026.pdf
5. Maryland Department of Legislative Services (DLS), 2026. 2026 – 90 Day Report: A Review of the 2026 Legislative Session. April 2026. Available at: dls.maryland.gov/pubs/prod/RecurRpt/26rs_90_Day_Report.pdf
6. Maryland Department of Legislative Services (DLS), 2026. Issue Papers: 2026 Legislative Session. Available at: dls.maryland.gov/pubs/prod/RecurRpt/Issue_Papers_2026_Legislative_Session.pdf
7. Maryland Department of Legislative Services (DLS), 2026. Joint Chairmen’s Report, Volume I and Volume II (2026). Available at: dls.maryland.gov
8. Maryland Comptroller / Bureau of Revenue Estimates (BRE), 2026. 60-Day Report: Impact of the One Big Beautiful Bill on Maryland. Available at: mdbre.gov/BRE_reports/federalimpact/60-day-report-obbb.pdf
9. Maryland State Archives / Maryland Manual On-Line, 2024–2025. Economy of Maryland: High-Tech Base, Trade, and Related Sections. Available at: msa.maryland.gov/msa/mdmanual/01glance/economy/html/economy.html
10. Maryland Department of Housing and Community Development (DHCD), 2026. FY2025 Annual Report. Available at: dhcdannualreport.maryland.gov/fy25; News releases April 2026. Available at: dhcd.maryland.gov
11. Maryland Department of Labor / Division of Workforce Development, 2026. Labor Market Information Resources. Employment Situation – January 2026. Available at: dllr.state.md.us/lmi/
12. Tax Foundation, 2026. Taxes in Maryland: 2026 State Tax Competitiveness Index and Related Data. Available at: taxfoundation.org/location/maryland/. Includes: 2026 State Tax Competitiveness Index (Maryland ranked 46th); State and Local Tax Burden 11.3% (rank 35); state-local income tax collections per capita $3,177 (rank 4th).
13. Tax Foundation, 2026. Americans Are Moving to States with Lower Taxes and Sound Tax Structures. State Migration Trends Data, April 2026. Available at: taxfoundation.org
14. Tax Foundation, 2025. Facts & Figures 2025: How Does Your State Compare? Available at: taxfoundation.org/data/all/state/2025-state-tax-data/
15. National Association of State Budget Officers (NASBO), 2025. Fiscal Survey of States: Fall 2025. Washington, DC: NASBO.
16. Pew Charitable Trusts, 2024. Managing Volatility: State Rainy Day Fund Design and Best Practices. Philadelphia, PA: Pew Charitable Trusts.
17. Maryland State Retirement and Pension System (MSRPS), 2024. Comprehensive Annual Financial Report FY2024. Baltimore, MD: MSRPS. (Pension funded ratio estimated at 65.7% as of FY2024.)
18. Maryland county fiscal materials, 2026. County Revenue Outlook: Fiscal 2026. Used for local fiscal-capacity context and county exposure to state and federal cost shifts.
19. Maryland Department of Budget and Management (DBM), 2025–2026. FY2027 Governor’s Budget Highlights and FY2027 Supplemental Budget Materials. Available at: dbm.maryland.gov
20. Maryland Accountability and Implementation Board (AIB), 2025–2026. Blueprint for Maryland’s Future Implementation Reports. Available at: aib.maryland.gov
21. CompTIA, 2024. State of the Tech Workforce 2024. Available at: comptiacdn.azureedge.net. (Maryland: 15th for net tech jobs; 228,266 tech workers; $37.8 billion tech industry contribution; 8.9% of state GDP.)
22. Milken Institute, 2022. State Technology and Science Index 2022. (Maryland ranked 4th.) Available at: milkeninstitute.org
23. WalletHub, 2024. Most & Least Innovative States 2024. (Maryland ranked 6th most innovative.) Available at: wallethub.com
24. Maryland State Archives, 2025. Maryland at a Glance: Economy – Trade. Maryland GDP 2023: $512.3 billion (up from $480.1B in 2022). AAA bond rating maintained as of May 2024. Available at: msa.maryland.gov/msa/mdmanual/01glance/economy/html/economy.html
25. U.S. Census Bureau, 2024. Population Estimates Program: State and County Population Estimates. Maryland population: 6,203,394 (2023). Available at: census.gov
26. BEA, 2026. Regional Data: GDP and Personal Income by State. Current-dollar personal income increased 3.4% annualized in Q4 2025 (state-level). Available at: apps.bea.gov/iTable/?reqid=70
27. Governor of Maryland / Office of the Governor, 2025–2026. Governor Wes Moore: FY2026 and FY2027 Budget Priorities and Press Releases. Available at: governor.maryland.gov
This is the fourth year of my first term as a Maryland State Delegate. I have the honor and privilege of representing District 9A in the Maryland General Assembly. After serving three years on the Ways and Means Committee, I am now serving on the newly formed Government, Labor, and Elections Committee.
Senator Katie Fry Hester and I established the Maryland Legislative STEM and Emerging Technology Caucus (https://marylandstemtech.org/). Our caucus includes two senators and eleven delegates, and we are working to strengthen Maryland’s STEM education pipeline while supporting responsible innovation in emerging technologies.
Affordability, accountability, and opportunity were the main themes of the 449th Maryland Legislative Session. Below are some of the key initiatives I sponsored and supported during the 2026 session.
Primary Sponsored Bill Highlights
During the 2026 legislative session, our office filed 13 bills—two passed both chambers, one passed the House, and one was incorporated into another bill that ultimately passed both chambers. This year’s work included legislation to strengthen school cybersecurity, support student learning, expand STEM and robotics education, lower utility costs, promote economic growth, and improve government transparency. Highlights of the bills that passed include:
HB0957 – Cybersecurity – Standards and Compliance – Alterations
This bill strengthens protections for Maryland students and faculty against cyberattacks by requiring local school systems to certify compliance with the State Minimum Cybersecurity Standards every two years, along with annual reviews by the Department of Information Technology. I am grateful to our Senate cross-filing partner, Senator Hester, for her support and mentorship.
HB0163 – County Boards of Education – Student Technology Use Policy – Requirements
This bill requires each county school board to develop and implement a policy limiting student use of cell phones and other devices during instructional time, while preserving exceptions for documented health needs, language translation tools, and other appropriate uses. After passing both chambers in different forms last year, it was merged into HB525 this year and passed both chambers.
HB1176 – Howard County – Board of Education Budget – Percentage of County General Fund Revenue
This bill requires the Howard County Executive and Howard County Council to report the percentage of general funds allocated to the operating budget of the Howard County Public School System. The goal is greater transparency and accountability in school funding. The bill takes effect July 1, 2026.
HB0531 – State Department of Education – Public Schools STEM and Robotics Program – Study
This bill seeks to expand STEM education and establish robotics competitions as varsity programs in public schools across Maryland. The amended bill passed the House but did not receive a Senate vote. I plan to bring it back in 2027.
This bill requires the Governor to annually proclaim January 13 as Korean American Day and encourages educational and cultural organizations to observe it with appropriate programs and activities. After four years of advocacy, this bill passed both chambers this session.
HB753 — Protects medically vulnerable residents from home tax sales.
HB156 — Allows individuals to change party affiliation during early voting in the primary.
HB852 — Expands a scholarship program to include correctional officers, supporting access to higher education.
HB637 — Maintains access to vaccines, screenings, and preventive services amid changes in federal law.
Affordability: Reducing Utility Cost
Lowering the cost of living, especially reducing energy cost, was a major focus this session. The bipartisan Utility RELIEF Act of 2026(HB1532 / SB841) reduces utility costs while strengthening Maryland’s energy system.
Returns at least $150 a year to Maryland households.
Prohibits utilities from charging ratepayers for excessive executive compensation.
Requires data centers to pay their fair share for impacts on the electric grid.
Prevents households from bearing the cost of extending power lines to remote areas.
Pauses speculative forecasting practices that can drive up family utility bills.
We still need to do more to address rising utility costs, and I plan to introduce additional legislative ideas for the 2027 session.
Opportunity: Supporting Economic Growth
I co-sponsored the DECADE Act (HB898), which creates a comprehensive 10-year plan to grow Maryland’s economy and position our state as a leader in future-focused industries.
Expands and modernizes the Build Our Future Grant Program with matching grants of up to $2 million for innovative infrastructure projects in high-growth sectors.
Revitalizes the RISE Zone Program to better connect higher education and federal assets with job creation.
Provides long-term tax credit for businesses engaged in research, development, and security-related work.
I also want to recognize my District 9A partner, Delegate Ziegler, for her bipartisan economic opportunity bill, HB0461. It helps rural jurisdictions compete for state and federal funding by providing technical assistance and capacity-building support to small towns and local nonprofits.
Additional measures this session expanded support for small businesses and entrepreneurs by increasing access to capital and technical assistance, raising revenue limits for cottage food businesses, simplifying franchise expansion, lowering operating costs through flexible business addresses, and encouraging transit-oriented development to create more housing opportunities.
Accountability: Government of the People
I believe in the government of the people, by the people, and for the people. That means making sure state government agencies operate efficiently, effectively, and transparently.
HB1369 establishes an Audit and Finance Compliance Unit and strengthens agency performance monitoring and audit follow-up.
HB1422 improves financial leadership standards and oversight of contract-related damages.
HB1557 increases scrutiny of high-cost real estate transactions to protect taxpayers from unnecessary spending.
HB0193 improves the state procurement system by making it more transparent, efficient, and predictable.
Other Legislative Highlights
HB661 — Muslim and Jewish Heritage Month Recognition
Requires the Governor to proclaim January as Muslim American Heritage Month and May as Jewish American Heritage Month.
Improves care quality and patient outcomes in Maryland nursing homes by requiring appropriate certification for physicians applying to serve as medical directors.
HB634 — Autism and Dementia Training for First Responders
Improves police training and coordination among first responders when interacting with autism and dementia communities during time-sensitive emergencies.
HB50 — Special Elections for General Assembly Vacancies
Requires special elections to fill certain early-term General Assembly vacancies. The bill did not pass because of various amendments, but I will continue supporting it next year.
Allows eligible military-connected students to enroll in Maryland public schools remotely, without fees or in-person requirements, helping prevent enrollment delays for students with disabilities.
Looking Ahead
The 2026 legislative session brought meaningful progress, but our work is far from done. As we look ahead, I remain committed to advancing practical, bipartisan solutions that strengthen our schools, support working families, grow our economy, and ensure government remains accountable to the people it serves.
Please feel free to contact me at chao.wu with any questions, concerns, or suggestions. I look forward to connecting with many of you at schools, restaurants, shops, community events and monthly Meet and Greet events across District 9A this summer.
Sincerely yours,
Delegate Chao Wu, PhD
Maryland House of Delegates
Legislative District 9A, Howard and Montgomery Counties
Government, Labor and Elections Committee
Co-chair, Maryland Legislative STEM and Emerging Technology Committee
Frankly, I did not pay much attention to this effort unitl I heard VA just signed into this compact yesterday. I think this will make presidential candidates have to appeal to the whole population, not just a slim margin of voters in a few states.
Maryland approved the National Popular Vote Interstate Compact (NPVIC) on April 10, 2007, becoming the first U.S. state to do so. Governor Martin O’Malley signed the legislation (Senate Bill 634/House Bill 148) into law, which pledges the state’s electoral votes to the presidential candidate who wins the nationwide popular vote.
The National Popular Vote Interstate Compact has now been enacted by 19 jurisdictions possessing 222 of the 270 electoral votes needed to activate it. They are shown in green on the map below.
Six additional states with 65 electoral votes (Arizona, Michigan, New Hampshire, Nevada, Pennsylvania, and Wisconsin) are especially promising places for obtaining the 48 electoral votes needed before 2028. They are yellow on the map.
SHORTCOMINGS OF THE CURRENT SYSTEM
Five of our 47 Presidents came into office without winning the most popular votes nationwide.
Every vote is not equal under the current system.
The current winner-take-all system regularly enables a few thousand votes in seven or so closely divided states to decide the Presidency—leaving 43 states and 80% of Americans on the sidelines.
Pepco recently filed a request with state regulators for a major distribution rate increase. If approved in full, here is what the breakdown would look like this coming year: Summer rates: 15% increase (5 months/year) Winter rates: 33% increase (7 months/year) Total weighted average: a 23% hike overall
This isn’t a one-time jump. If this plan is approved as it stands, distribution rates will have skyrocketed by an average of 63% since 2020 and a staggering 132% since 2016. Learn more about the proposed rate increase. Make your voice heardThe Maryland Public Service Commission will hold two virtual hearings to receive public input on PEPCO’s proposal to increase its electric distribution rates.
Participate in virtual hearing: The hearings will be held Tuesday, April 14, 2026 at 6 p.m. and Friday, April 17, 2026 at 6 p.m. You are welcome to attend one or both hearings.To participate at the virtual hearing, attendees should email kimberly.schock@maryland.gov by 12 noon on Friday, April 10 for the first hearing and by 12 noon on Wednesday, April 15 for the second hearing. Attendees will receive a link for the virtual meeting. A recording will also be posted to the Commission’s YouTube channel.Submit written comments: Written comments may be submitted electronically through the Commission’s website, in the Public Comments Dropbox. First-time users of the portal will need to register and then can submit their comments in Case No. 9820.Comments may also be sent by mail (by June 1, 2026) and should be addressed to: Andrew S. Johnston, Executive Secretary Maryland Public Service Commission William Donald Schaefer Tower, 16th Floor 6 St. Paul Street, Baltimore, MD 21202 Evidentiary hearings in this case are scheduled to begin April 27, 2026 with a Commission decision in early August.
Want more ways to optimize your home appliances and lower your monthly Maryland utility costs? Check out OPC’s energy efficiency tips.Myth vs. reality: Your utility billIt’s time to clear up the confusion around Maryland’s energy costs. There’s a lot of talk about “resource adequacy,” the idea of whether our state has enough power to keep the lights on when demand is at its peak, like during the hottest days of the year, but the facts might surprise you.
Myth: Your bill is higher because Maryland is a net importer of electricity. Truth: Maryland customers benefit from being part of a diverse regional system. The State has imported a portion of its power needs for many decades because it is more economical, and most PJM states do the same. In fact, existing Maryland power plants could generate additional electricity in-State, but the costs would be greater than importing electricity. Want the full report and bust more myths? Read more to stay informed and protect your wallet.How are your electricity supply rates set?Ever wonder how the price of electric “standard offer service” (SOS) is determined? It’s not a random number; it’s a strategy to keep your costs stable.
The auction: Your utility doesn’t own power plants. The regional transmission operator, PJM, holds auctions in which private generating companies bid the lowest price to win a contract to supply your utility company with electricity.The “ladder” strategy: Instead of buying all the power at once, utilities buy in “slices” using overlapping 24-month contracts.Stability: Because these contracts end at different times, you are protected from sudden, massive price spikes if global energy costs jump.Supply vs. delivery: The rate is only for the electricity itself. You pay a separate distribution charge for the poles and wires that deliver it.The bottom line: Your energy supply rates are shaped by a competitive market and a “slow and steady” buying process designed to protect your wallet. Read more about “SOS”.
Which of these is typically the biggest source of energy loss in a Maryland home? A) Leaving the lights on in empty rooms B) Air leaks through the attic, basement, and crawlspace C) An old, inefficient refrigerator D) Keeping electronics plugged in (phantom power)
The Answer: B) Air leaks through the attic, basement, and crawlspace.
While the other options definitely add up, air leakage is the heavyweight champion of high utility bills. Most Maryland homes lose a massive amount of heated or cooled air through the “envelope” of the house, especially through the attic floor and basement rim joists.Ready to find your leaks? A home energy audit uses a “Blower Door Test” to find exactly where your air is escaping.Learn where to get a free home audit here. How to read an Energy Star labelAre you in the market for a new refrigerator, dishwasher, or other major appliance? Don’t let the bright colors fool you; that yellow and black EnergyGuide label is your secret weapon for making a financially smart choice.Understanding this label is a core part of utility literacy because it helps you see the true cost of ownership beyond the purchase price.Level up your appliance game, check out our website to learn how to read an Energy Star label.Is your home leaking money?Spring weather is here; it’s the perfect time to give your home a “wellness check.” If your utility bills are higher than expected, a home energy audit is a smart first step toward year-round comfort.Why get an audit this month?Stop the leaks: Find hidden gaps where your expensive AC escapes.Expert data: Get a professional report, leaving out the guesswork.Free: The EmPOWER program covers the cost of the audit and may offer thousands in rebates for upgrades.The result is lower monthly bills and a home that stays cool all summer long.Contact your utility company and request a free audit to start your home’s efficiency makeover today.Complaint against your utility company?If you have a problem with a utility company (like electric, private water, or gas), you can file a complaint with the Public Service Commission (PSC) and their Consumer Affairs Division (PSC/CAD). The PSC regulates utility companies, and the CAD investigates people’s complaints. Learn about how to file a complaint.Financial Literacy MonthApril is Financial Literacy Month, and there’s no better time to take control of your household budget. For many Marylanders, utility costs are one of the largest monthly expenses, but they don’t have to be a mystery.Understand not just what you owe, but how you can lower it through smart habits and State resources.Decode your bill: Don’t just look at the “Total Due.” Check your usage history (usually a bar graph on your statement). Comparing this year’s April to last year’s can help you spot unusual spikes that might indicate a leak or a failing appliance. Check out how to read your bill. Leverage assistance: Financial literacy is also about knowing what forms of energy assistance there are. If you are struggling with a balance, help is available. Small changes, big compound interest: Just like saving money, small energy habits compound.For questions or assistance, contact Brandi Nieland, Director of Consumer Assistance at brandi.nieland@maryland.gov. Your People’s Counsel is David S. Lapp. Our team is here to help and advocate for you. We represent Maryland residential customers before the Public Service Commission and federal agencies, and we provide you assistance dealing with your utility issues, including affordable and reliable service. To see what OPC is currently working on, click here for our recent press releases or click here for our media coverage.Office of People’s Counsel • (410) 767-8150 / (800) 207-4055 • www.opc.maryland.gov
This email was sent to chaowu2016@gmail.com using govDelivery Communications Cloud on behalf of: Maryland Office of People’s Counsel · 6 St. Paul Street, Suite 2102 Baltimore, Maryland 21202
Marylanders are facing rising energy costs driven by the convergence of several forces — rapidly rising demand, delays in bringing new power online, and shifting national policies.
This is a regional challenge requiring regional and national solutions. The PJM grid covers 67 million people across 13 states, and no single state can solve these pressures alone. But Maryland is using every tool available to lower costs, increase supply, protect ratepayers, and affirm our commitment to clean energy goals.
HB 1532, the Utility RELIEF (Reducing Energy Load Inflation for Everyday Families) Act, is a package of bills that builds on the 2025 Next Generation Energy Act and is grounded in four priorities: protecting ratepayers, ensuring reliability as demand grows, advancing clean energy, and preserving programs that reduce costs over time.
This bipartisan legislation passed the House by a vote of 108–25.
Key Priorities:
Protect Maryland ratepayers. We will make electric bills more affordable (by at least $150 annually[1]) by strengthening oversight of utilities, limiting excessive utility executive compensation from being passed onto customers, reforming rate-setting practices, and ensuring large energy users pay for the infrastructure needed to support their demand.
Respond to rising energy demand—especially from data center growth. Electricity demand is increasing in Maryland, driven in large part by rapid data center development powering artificial intelligence and the digital economy. We will ensure that new large energy users are accountable for their grid impacts.
Address national energy pressures and federal policy changes. The federal government recently increased subsidies for fossil fuels while reducing support for energy efficiency and clean energy programs. These decisions are raising costs for consumers and slowing the transition to more stable and affordable energy sources. We will protect Maryland ratepayers while maintaining our long-term commitment to a cleaner and more resilient energy system.
Preserve and strengthen the programs that reduce energy costs over time. Programs like EmPOWER have helped Marylanders reduce energy consumption and improve the efficiency of their homes and businesses, making energy use more affordable and sustainable over time. We will improve how these programs operate so they continue delivering savings for households long–term while also managing the short-term costs.
Accelerate reliable clean energy generation. New electricity generation has been delayed for years due to backlogs within the PJM grid. Hundreds of megawatts of new clean energy projects have been stuck in the approval queue for years. As a result, supply has not kept pace with demand, putting upward pressure on prices. By streamlining siting, supporting zero-emission energy sources, and deploying tools like competitive public auctions for renewable projects, Maryland can bring new power online faster while maintaining its commitment to clean and sustainable energy.
OVERVIEW
Improve Affordability
Protect Ratepayers from Excessive Compensation. This bill ensures that excessive executive compensation and bonuses cannot be passed on to customers through their utility bills. It protects ratepayers from paying for corporate pay packages that are unrelated to delivering reliable energy service.
Regional Transmission Organization (RTO) Membership. Utilities currently receive additional payments simply for participating in the PJM regional grid operator. This reform follows the lead of other states and essentially eliminates that extra cost on ratepayers and keeps the utilities in PJM.
Net Energy Metering. Our net energy metering policies need to be updated to acknowledge a more mature market. We will transition and save ratepayers money by changing the compensation structure for excess solar power that customers generate and send to the grid.
Multi-Year Rate Plans. Utilities will no longer be able to set rates based on projected costs that may not reflect actual expenses (forecast test years). Instead, rates will be established using real historical data (historic test years), ensuring the initial rate-setting process is grounded in actual costs and helping prevent inflated rate increases for customers.
Removing the gas EmPOWER surcharge. This change allows utility companies to focus on the electrification, weatherization, and demand response aspects of the EmPOWER program and ensures that every dollar spent through EmPOWER helps Maryland transition to cleaner and more efficient buildings.
Exploring options to lower overhead costs by transitioning to a single administrator. The EmPOWER program is currently administered by Maryland’s largest utility companies. Each utility operates a different program through contractors and operates at various levels of cost-effectiveness. Streamlining EmPOWER would create more certainty for consumers and give the Public Service Commission and the Maryland General Assembly better oversight of the program.
Shifting costs on electric bills for the next program cycle. EmPOWER programming runs on a 3–year cycle. To ensure that every Marylander’s utility bill achieves cost savings in each of the next three years, we are slightly reducing the scope of the utility–administered programs and using a portion of the Strategic Energy Investment Fund to pay down some of the EmPOWER costs.
These reforms maintain the value of the EmPOWER program while reducing short-term utility bill impacts, especially in a moment when federal policies are driving price spikes by increasing fossil fuel subsidies, slowing clean energy development, and cutting funding for energy efficiency.
Preserving EmPOWER is critical because eliminating it would result in higher energy costs for Maryland families for years to come.
Capital Expense. Utilities make money by building and owning infrastructure, on which they get a rate of return. Before utilities spend billions building new infrastructure that increases customer bills, they will have to evaluate lower-cost solutions such as grid-enhancing technologies and require local transmission projects to undergo regulatory review. This helps ensure the grid is modernized in the most cost-effective way for ratepayers.
Retail Choice. We will encourage more confidence in consumer choice and competitive pricing by strengthening Maryland’s retail energy market for suppliers.
DRIVE Act: The DRIVE Act (Distributed Renewable Integration and Vehicle Electrification Act) is a 2024 law designed to modernize Maryland’s electric grid by integrating technologies like electric vehicles, battery storage, and other distributed energy resources into the grid. It promotes tools such as time-of-use electricity pricing, vehicle-to-grid charging, and virtual power plants so customers can help supply energy to the grid during peak demand and lower overall system costs. The rebate program is currently administered by utilities. Under an amended provision to this law, it will instead be administered by the Maryland Energy Administration at no additional cost to the ratepayer. This change allows these innovative time-of-use electricity programs to continue without raising utility bills. Customers can still benefit from programs that reward shifting energy use to lower-cost times of day.
Low Income Energy. This reform streamlines how energy assistance programs are administered within the Office of Home Energy Programs (OHEP), improving operational efficiency and making it easier for low-income households to access the support they need. It reduces administrative overhead and directs more resources to families who need help paying their energy bills.
Enhance Generation
Clean Energy Reverse Auction. We will continue to enhance energy generation opportunities in the state by using funds collected from renewable energy alternative compliance payments (ACPs) to build new clean energy projects in Maryland through a reverse auction. This approach means clean energy developers compete to offer projects at the lowest cost, allowing the state to select the most affordable proposals and deploy renewable energy quickly while ensuring the lowest possible cost to ratepayers.
Energy Permitting Improvements. These reforms make it easier to build clean energy projects in places where it makes sense to, such as on rooftops, while reducing unnecessary permitting delays. By accelerating where and how projects can be built, Maryland can bring new energy generation online faster, which helps stabilize supply and reduce long-term costs for ratepayers.
Strengthen and Support Clean Energy Generation. We will make targeted reforms to Nuclear Zero-Emission Credits and streamline solar generation procurement to ensure these programs are more effective. Supporting a diverse mix of zero-emission energy sources helps ensure reliable electricity supply while protecting ratepayers from long-term fuel price volatility.
Focus Strategic Energy Investment Fund (SEIF)
Alternative Compliance Payments. As noted above, we will use ACPs to support competitive, low–price public auctions for renewable generation.
Reform SEIF. We will further reform other revenue in the Strategic Energy Investment Fund to ensure it is used for affordability and investments in our energy future.
Data Center Accountability
Large Load Tariff. Large energy users like data centers will be required to pay the cost of the infrastructure needed to support their electricity demand. This prevents residential ratepayers from subsidizing the energy needs of large commercial facilities.
Transparency. We will require clearer reporting and oversight of the energy use and grid impacts of large data centers. Greater transparency helps ensure responsible development and protects grid reliability.
Set Expectations. Data center operators who want to build in Maryland will be expected to bring their own clean energy resources, participate in demand response programs, and contribute to local community benefits. This encourages large new facilities to support the grid rather than strain it.
Increase Accountability and Transparency
Closing Transmission Line Loopholes. Underground transmission lines will be subject to review by the PSC, something that currently only applies to overhead power lines. This limits the ability of utilities to build new lines at will and pass along the cost to ratepayers without the benefit of oversight or review.
Tracking Proceedings. We will require increased transparency and tracking of major PSC proceedings. This reform improves public visibility into major regulatory decisions at the PSC. Stakeholders will be able to track key proceedings and understand how decisions affect energy policy and utility rates.
Energy Bill transparency. We will require increased access to clearly stated information about energy bills that allows consumers to better understand what is included in their energy costs.
Quick Quotes
On savings:
“Every dollar saved on utility bills means more money for groceries, rent, gas, medicine, and everyday costs of living. When you add up those savings across Maryland, it means hundreds of millions of dollars staying the pockets of working families.”
“Federal policies are wreaking havoc on our economy. Tariffs have made grocery prices soar. A war in Iran has made gas unaffordable. Billionaire tax breaks have funded health care cuts. And expensive fossil fuels are subsidized while more affordable, renewable, and sustainable clean energy projects get the chopping block. But here in Maryland, we are focused on doing what responsible leaders should do: lowering costs wherever we can for the families we serve.”
On data center accountability:
“Working families shouldn’t be subsidizing the energy demands of massive data centers. If you’re driving up demand, you should help cover the costs.”
On energy generation:
“This bill aligns incentives to create new energy generation to meet consumer demand and help lower prices.”
On commitment to clean energy goals:
“We’re not choosing between today’s costs and tomorrow’s climate. We are addressing both. The most responsible path forward is the one that meets this moment and prepares us for the next.”
[1] $150 in annual savings is the minimum base savings from changes to the EmPOWER program, which take effect immediately. When accounting for all proposed policy changes collectively, utility bills are expected to decrease further across the short–, medium–, and long–term.


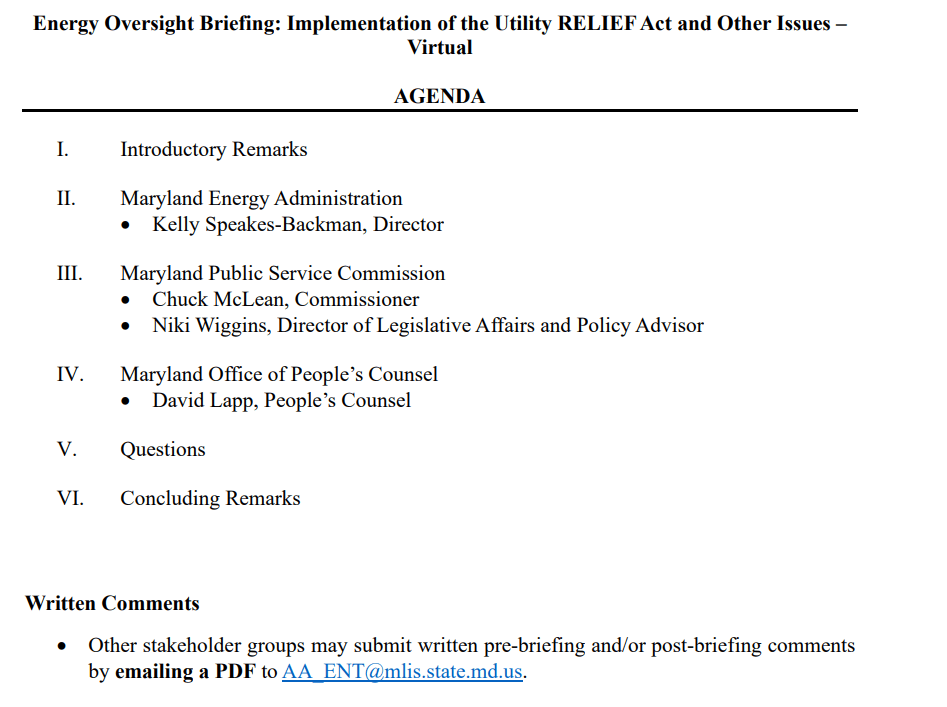




 How are your electricity supply rates set?Ever wonder how the price of electric “standard offer service” (SOS) is determined? It’s not a random number; it’s a strategy to keep your costs stable.
 Is your home leaking money?
 Spring weather is here; it’s the perfect time to give your home a “wellness check.” If your utility bills are higher than expected, a home energy audit is a smart first step toward year-round comfort.Why get an audit this month?Stop the leaks: Find hidden gaps where your expensive AC escapes.Expert data: Get a professional report, leaving out the guesswork.Free: The EmPOWER program covers the cost of the audit and may offer thousands in rebates for upgrades.The result is lower monthly bills and a home that stays cool all summer long.Contact your utility company and request a free audit to start your home’s efficiency makeover today.Complaint against your utility company?If you have a problem with a utility company (like electric, private water, or gas), you can file a complaint with the Public Service Commission (PSC) and their Consumer Affairs Division (PSC/CAD). The PSC regulates utility companies, and the CAD investigates people’s complaints.
  Financial Literacy MonthApril is Financial Literacy Month, and there’s no better time to take control of your household budget. For many Marylanders, utility costs are one of the largest monthly expenses, but they don’t have to be a mystery.Understand not just what you owe, but how you can lower it through smart habits and State resources.Decode your bill: Don’t just look at the “Total Due.” Check your usage history (usually a bar graph on your statement). Comparing this year’s April to last year’s can help you spot unusual spikes that might indicate a leak or a failing appliance.
  For questions or assistance, contact Brandi Nieland, Director of Consumer Assistance at